Sunday, December 10, 2006

E&O


E&O
1)This counter is potentially to go higher, because of its volume increase and the price keep steady moving up.
2)I have enter its warrant at RM0.55, i would think that, in bull market, the warrant will be faster than its mother. refer to attached link for detail ;http://chinese.cari.com.my/myforum/viewthread.php?tid=719256&extra=page%3D3
3)This counter just break one year high , it will attract TA trader to join in the game.

Re-enter IPOWER


Ipower
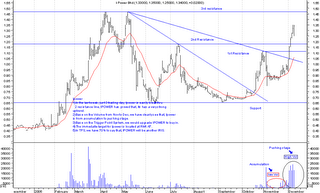
1)In the last week, just 3 trading day, Ipower is easily breakthru 2 resistance line, IPOWER has proved that, its has a very strong uptrend.
2)Base on the Volume from Nov to Dec, we have clearly see that, Ipoweris from accumulation to pushing stage.
3)Base on the Trigger Point System, we would upgrade IPOWER to buy in.
4)The immedaite target for Ipower is located at RM1.47. 5)In TPS, we have 70% to say that, IPOWER will be another IRIS.

Wednesday, November 29, 2006

Re-enter market , N2N will be a good future counter.

Today re-enter the market again, only pick up on N2N , believed that N2N will give me very good return in coming 2-3months. today bought in at RM 1.87 , my sixth sense telling me, i can get at least 50% return.

Tuesday, November 28, 2006

Market update on 28/11/06 1630hrs

Market is fishy now, i have unload all my CA counter and Acoustec.
Rest for a while and see how the market perform and wait for another opportunity.
Happy trading and profitable.

Sunday, November 05, 2006

IPOWER

IPOWER is coming to a junction;
1)If Monday can reverse and stay above 1.00 in the afternoob, it has potential to move even higher.
2)If unfortunately, IPOWER go below 0.86, in TPS we will consider game over.

Personally i have exit this counter at average price at 0.995 , if Monday afternoon this counter can above 1.00, i will consider re-enter.

Saturday, October 28, 2006

Thursday, October 26, 2006

N2N charting


N2N is almost completed its profit taking correction in tight range trading, pls take note

Tuesday, October 24, 2006

SUGAR and IPOWER TA view


SUGAR
Basically base on the sugar chart,
1)From July to September is running slow and steady pattern (still got 100% return)
2)From October Onward, the uptrend line has been changed to aggressive uptrend.Believe that in short term will see RM2.50 to RM3.00
3)The above is base on the TA Judgement, Just for the knowledge sharing purpose.

IPOWER
Ipower has break out its short term down trend line,base on the chart theory, it will test on the immediateresistance which located at 1.18, If the 1.18 brakthru is successfully, it will test again on its next level of high which located at 1.47.

Wednesday, October 18, 2006

IPOWER

Today Ipower is showing its strength , believed that IPOWER will extend its strength to even higher, its price at 1500hrs RM0.90.
pls take note.

Happy trading and profitable.

Sunday, October 15, 2006

Bull Run on KLSE market


My last post comment section have mentioned about the Bull run had been started in KLSE market, and this is a golden opportunity for us to gain money from the market and this will be a big money can be gain.

This bull run will be started with the blue chip 100link counter , Example; Tenaga, commerce, Maybank and etc.. , but in order to get a good return in term of percentage, i will not pick up on the mother share, i will rather choose the warrant or Call warrant because the warrant will give even higher return than thier mother share.

In my coming post i will keep updating on my portfolio performance on the KLSE, see attached picture for the detail.

Happy trading and profitable.

Thursday, September 28, 2006

Acostec (7120)

Has been so long never update the blog. Yes, is busy on new formula testing and fine tuning, is to acieve a stress free trading.
Acostec (7120) is a stock selection from my formula , target to hold 3 month for a short term trading, not for contra.

28/9/06 closed at RM0.89
Happy trading and profitable.

Monday, August 21, 2006

CFD play: Short Sell Chartered Semiconductor Mfg


CSM started its peak price from S$1.87 (27/4/06) to the lowest price at S$1.03 , the trend of this counter is still in the down trend, the recent technical re-bound has reached to the end.
For CFD play, we would short sell for Chartered and its closing price on 21/8/06 at S$1.20

Thursday, August 17, 2006

Mobif

I have received some reader phone call on Mobif, they need to know how will be its performance;
My opinion on Mobif;
1)My system is not to trade on this kind of pattern.
2)I advise them that , if they want to trade in this pattern, they have to prepare money to be loss before they move forward for trading.
3)To trade on this kind of pattern is to catch the technical re-bound.
4)If you dare to catch the technical re-bound , you should pray tomorrow limit down again, which around RM1.24 and this price is suitable for playing technical re-bound.
5)Pls prepare you cut loss and profit taking point.

Good Luck and Profitable Trading.

Friday, August 11, 2006

Speculative counter Technical re-bound

After so many day selling force on Speculative counter , ex: tebrau, eden leader. Finally they start to fight back and technical re-bound, if they can still go and test for their previous high, mean they still potential.
Plantation counter will still lead the market; Ex; IJM plantation.

Thursday, August 03, 2006

Market Direction before FOMC meeting

The market has run on sideway for last 6 day after CI reached to 939 , and we have mentioned on 31July06 (last post comment section) that the market will profit taking ;
1)The current support for the profit taking is located at 926 to 928.
2)926 can not be broken, else it will go correction which to be support at 913.
At this point of time , the bullbear indicator still in uptrend but we also need to cautious , because the market has been raised up to 35 points from its recent low (900).

Happy trading

Sunday, July 30, 2006

Malaysia Market direction on coming week (early August 06)

Malaysia Market direction on coming week (early August 06)
1)The Market uptrend signal has appeared on the last week.(refer to my last post for the detail)
2)In this stage of uptrend , only some counter can be contra, and it is suitable for position trading.
3)Position trading will allow you to gain more profit than your intraday or contra trading.
4)Only the counter with good momentum are good for position trading, Counter like, Rsawit , BCT tech and etc are good for position trading.
5)Speculative counter like, Eden , Leader will have potential to move higher after its consolidation.

Eden and Leader
1)The eden immediate support to be located at RM0.56
2)This counter has shown its strengthness on last week, if you see this counter can stay above 0.56 then its has higher probabilty to move up.
3)base on the chart, this counter can not below 0.49, if Eden below 0.49 , will be a dangerous sign, pls take note.
4)I dont forcast how much it will raise up, but we will base on the chart signal to execute the exit point.
5)Leader support is located at 0.43 , this counter is a follower of Eden, any major move on Eden will affect Leader too


Happy Trading and Good Luck

Wednesday, July 26, 2006

BullBear on 25Jul06


1)The early signal has appeared on the uptrend.
2)In the early uptrend, pls donot contra too much, it is suitable for position trading.
3)Position trading will allow you to gain more profit than your intraday or contra trading.
4)Only the counter with good momentum are good for position trading, Counter like, Rsawit and etc are good for position trading.
5)The market now is solid on the CI 100 link counter. but sideway on 2nd and 3rd liner, so donot contra too much.
Happy Trading and Good Luck

Monday, July 24, 2006

Sideway market

As continue from last week, the charateristic of raise of index and fall on counter has signal selling pressure on speculative counter , 2nd and 3rd liner which i have mentioned inside the last post comment section.
Therefore the market now is enter into a sideway market. Honestly , i like the sideway market , we need to standby our capital to fight for a high winning probabilty game, one high profit margin and high probabilty game will appear, Once again, i will update inside this blog, if the signal appear.
Again, in sideway market, pls dont intraday trading and contra, you winning percentage is low.

Wednesday, July 19, 2006

Market direction update on 19Jul06

Well, we have seem the technical re-bound which expected happen on tuesday(18/7/06) and unexpected sell down on majority speculative counter ex; Iris, MTDinfr , tebrau , Polytwr and etc...

My advice here on short term are;
1)To avoid or side line the speculative counter for a while , we need to wait for the market to be cleared then we start to put in our troops again. Seem like the sell down is target on speculative counter.
2)As i have mentioned many time , our CI have to stay above 915 and steady then our market will extend its strength to another level (early stage uptrend level). the immediate CI support at 898

Happy trading.

Monday, July 17, 2006

Market Direction for very short term.

Market has entered into profit taking correction, its immediate support located at 898 .Market momentun is still intact as long as it can above 900.

By base on today (17/7/06) market movement, its has found to be support at above 900,we can see that market selling force has been reduced, below are the event to be appeared;

1)Technical re-bound will be appeared in short term and the resistance to be located at 915.
2)Since we has exit market on last Friday, we are able to enter market to buy at the cheaper price on technical re-bound.
3)Counter to be monitor for technical re-bound; Sugar , RHB , Tebrau and etc....
4)If you join for the technical re-bound, pls remember to put on your profit taking and cut loss point.

17/7/06 (Monday) closed at 902.7


Happy trading.

Friday, July 14, 2006

Market uncertain and Stay sideline

The crisis on middle east and the oil price is keep increasing, the market is uncertain now . Look back on our CI from 883 to 929 it has been climbed up for 47 point and market has shown slow down on all index. Pls reduce your stake and stay sideline until the market is clear then we start to put in our troops.

Monday, July 10, 2006

NOVA , NSCOM and GHLSYS

The main board counter has been moved for a month, and now its about the time for masdaq counter , the above mentioned NOVA, NSCOM and GHLSYS believe will help to push mesdaq to another level. Please set your profit taking point and cut loss point accordingly.

The closing price for the following counter 0n 7Jul06 are;
1)NOVA-RM0.12
2)GHLSYS-RM0.25 and
3)NSCOM-RM0.245

Even market is profit taking on certain counter and cause index to drop, but the market volume indicate that the KLSE is still intact with the uptrend.

Happy Trading.

Saturday, July 01, 2006

Will CI move to solid uptrend stage (Phase 2)?


Our CI has move into a very early trend, from 890 to 917 ( here we call phase 1), and it will facing a strong resistance which located at 922 ; thing we need to take care on coming week
1)The profit taking will take place .
2)The support level has move from 900 to 907.
3)Watch out for the CI , If CI able to above 922 , the trend will be change from early stage to solid stage.
For the solid stage, we call Phase 2 (If move to phase 2, i will explain on its charateristic).
4)If the CI enter to phase 2, you can consider to pump in more capital; for example 60-70%

Premium 9458
1)The upside signal appeared 5 days ago.
2)Currently is forming uptrend base. ( take note)
3)watch out on any trading day, afternoon session, if above RM0.30, this counter will be the black horse.
4)You entry point should be RM0.30.
5)30/6/06 close at RM0.245
6)Pls set you cut loss point accordingly.

Monday, June 26, 2006

A Very early stage of uptrend

The market has enter into a very early stage of uptrend , the charateristic of the very early stage are;
1)most of the counter has technical re-bound and retract and stabilize.
2)Some selective counter will lead the market to move.
3)Those whose has game over counter will try to push higher & distribute.
4)The trend is fragile , if any crash in US market will be changed in term of trend.
5)The last is, the NEW BLACK HORSE will appear .

The CI immediate support located at 895-900 , the current market stratergy is mainly on the stock selection. ( In very early stage , not all stock will move , only some selective counter will run).

Happy Trading

Sunday, June 18, 2006

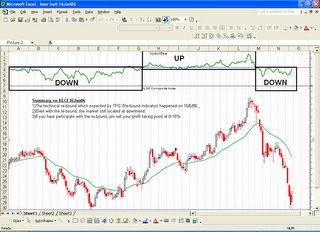
Bull Bear indicator on 15Jun 06 (weekly summary)


We have anticipated technical re-bound at 880+ level, we actually use one of the technical re-bound indicator and accurately capture the right timing.
If you have follow the technical re-bound, remember that ;
1)Technical re-bound is temporarily.
2)Must know how to profit taking, donot set un-achievable target profit.
3)Some game over counter has been push up to higher and to distribute, Just to be alert.

Re-view on current market, the bullbear still shown KLCI in the downtrend zoom, we will keep monitor on bullbear index, anything change in trend will update in this blog.

Thursday, June 15, 2006

Fear + Blood = Technical rebound(Short term trading)

Just look at the EOD data, what do you think i have seem on the screen? Try to guess ???
Is full of fear and blood inside the screen and it has reflected a signal to re-entry at 880+ level.
Look back my call on ;
1)12May06- an article "Bull/Bear sentiment indicator (Market X file) " -Awareness of market trend change.(CI at 960+)
2)19May06-an article "Bull Bear indicator on 18May 06 "-reduce you stake or withdrawn your stake and away the market.(CI at 950+)
3)12Jun06-an article "Bull Bear indicator on 9Jun 06 (weekly summary) "-Reduce your stake to minimum and dont fight against with market force.(CI at 910+)

And today, we can re-entry market at 880+ level for short term trading which from 1 day to 3 month, your capital should be about 40 to 50% can be invested in market. Remember that you must know how to take the profit and cut loss if you join for this technical re-bound wave. Pls remember too, this time of technical re-bound is not bull run, not all the counter can earn money, some counter actually has been game over , the stock selection is very importance.

Happy trading!!!

Monday, June 12, 2006

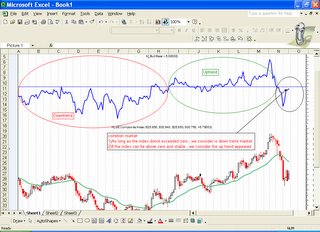
Bull Bear indicator on 9Jun 06 (weekly summary)


The World cup has been kick off on last Friday 12am, the event finally come, in historically data shown during this period of time the market is mostly slow down, therefore , believe the data given by the market on past year exprience, try to reduce your stake in market, donot fight against the market force.

I have stop myself from monitoring on realtime pricing, i will only to collect data during end of day.

My profolio is only on ;
ETITECH bought on 31May06 at the price RM1.08

Happy trading and enjoy the World cup event.

Friday, June 09, 2006

World Cup 2006

World Cup will be kick off tonight 12pm, with the first game in between Germany vs Costa rica, i will definately not miss the game ( I also like to watch and bet a bit on football) , In singapore, the betting on football is legal , we can easily place the stake at the "singapore pools " outlet , anyway the betting is not so encourage, but the most ultimate things is we get the fun on watching football.

I will respect for this World Cup and will offline myself from monitoring on the daily pricing on the KLSE. But i will still update the bull bear indicator in the weekly summary of the market .

I have cut loss on waseong at 1 cent below the support level and my portfolio left only;
ETITECH bought on 31May06 at the price RM1.08

Happy trading and enjoy the World cup event.

Sunday, June 04, 2006

Daily Bull Bear indicator on 2Jun 06 (weekly summary)


Last week the sentiment of overall market has been stabilised but still located in the down trend , The CI immedaite support is at 919,

Summary of our last week activities , We have created portfolio in this down turn as follow;
1)ETITECH bought on 31May06 at the price RM1.08
2)Waseong bought on 2Jun06 at the Price RM2.47

We will still use the same indicator to follow thru the market. Any special case or major trend change will be update on this blog.

Disclaimer: This blog is not to be construed as a recommendation to buy or sell any securities. All information and comments are provided for educational purposes only. I however do not hold myself responsible for its accuracy as well as your stock trading or investing decision.

Saturday, June 03, 2006

Our portfolio in this down turn market

In Trigger Point system, we have 2 stratergies of investment , there are bull run(Uptrend) stratergy and Bear run stratergy (Down trend) . We will base on the Bull Bear index to indetify the current market and apply the correct stratergy.

The Bull run Stratergy and the Bear run stratergy there are some difference in term of Technical analysis application and fund management application.

Our portfolio in this down turn as follow;
1)ETITECH bought on 31May06 at the price RM1.08
2)Waseong bought on 2Jun06 at the Price RM2.47

Friday, June 02, 2006

Waseong

In today world, oill price is keep going break the record high , Waseong is one of the counter will be benefit from here, yesterday waseong closed atRM2.40, if you interest on this counter, prepare your cut loss and profit taking point

Disclaimer: This blog is not to be construed as a recommendation to buy or sell any securities. All information and comments are provided for educational purposes only. I however do not hold myself responsible for its accuracy as well as your stock trading or investing decision.
Wednesday, May 31, 2006

ETITECH 0118

Yesterday 30/5/06 closed at RM1.05 , can be monitored at this down turn market, if you are interested, pls set you cut loss point and profit taking points.

Disclaimer: This blog is not to be construed as a recommendation to buy or sell any securities. All information and comments are provided for educational purposes only. I however do not hold myself responsible for its accuracy as well as your stock trading or investing decision.

Saturday, May 27, 2006

Daily Bull Bear indicator on 26May 06 (weekly summary)


Last week the sentiment of overall market has been technical re-bound, the sentiment index from the -52 (22/5/06) to -5 (26/5/06) , the coming week is importance to determine the strongness of the KLSE market whether it will extended its strength or just Technical re-bound.
Summary of our performance on lase week, we are able to use the intraday bull bear indicator to capture the technical re-bound at the right timing and the right counter. the following day we will still use the same indicator to follow thru the market. Any special case or major trend change will be update on this blog.

Wednesday, May 24, 2006

Intraday bull/bear indicator.

Good News, We have invent another indicator called intraday bull/bear indicator , this indicator is to enable us to catch for the technical re-bound, Ex : we are able to catch the technical re-bound on 23/5/06, 1030hrs(detail can refer to last post Bull Bear indicator on 18May 06 under comment session) . my suggested stock was Time engineering at 1030hrs at the price of RM0.60
This indicator can give the early signal of market sentiment of re-bound and fall down during intraday.
The combination of time pattern , volume pattern , bull bear indicator and CI index will tell us the timing of re-bound and price drop during intraday.

Friday, May 19, 2006

Bull Bear indicator on 18May 06


The Market now is into correction, any rebound will be temporarily, reduce you stake or withdrawn your stake and away the market. We human being need to have a rest and market also need to have a rest. World Cup is coming in the corner, have some fun on world cup. A monemt of rest will allow you to go long journey. After the world cup will be another new trend.
Pls note that this indicator is a thermometer to the overall market, is not specified to any particular counter.

Wednesday, May 17, 2006

IPOWER (Follow up on recent profit taking correction)

TECHNICAL REBOUND ON IPOWER
With the hammer sign appear on the IPOWER yesterday(16/5/06), it has tell us that the ipower is going to technical rebound, the re-entry price will be 1.17 , pls donot enter below 1.17 (this is not the entry signal), your cut loss point will be at 1.08 , pls double click on the chart for the detail. (updated on 17/5/06 6am)


Disclaimer: This blog is not to be construed as a recommendation to buy or sell any securities. All information and comments are provided for educational purposes only. I however do not hold myself responsible for its accuracy as well as your stock trading or investing decision

Friday, May 12, 2006

Bull/Bear sentiment indicator (Market X file)


Trigger Point System just recently invent on a new indicator called Bull/Bear sentiment indicator , this indicator typically is to check on the overall market sentiment, the data is captured from the EOD .
from the data shown , the overall market sentiment has turn from 8/5/06 at the figure 75 to 11/5/06 at the figure of 31, the message here is BEWARE OF MARKET figure go below zero

The advantage of this indicator is to get the early signal before market go sideway , uptrend and down trend.

Pls note that this indicator is a thermometer to the overall market, is not specified to any particular counter.

Monday, May 08, 2006

IPOWER ( To answer my reader question)

Here, i would like to thanks to my royal reader and some question has been raise up by them on IPOWER thru e-mail, so, i would like share with everybody here;

1)when will this counter test on RM1.47 level ?
TPS: IPOWER has been taken 6 days to re-bound from the bottom (1.10 to 1.43), no doubt, tomorrow it will test on this level.

2)Will this counter still be extended its strength?
TPS: On TPS point of view, this counter is consider intermediate term trading counter, of course it will extened its strength to go higher to this level. this counter will have some price retracement (profit taking) but in intermediate term, it will give handsome profit for the investor.
a) Potential Target price for intermediate term( less than 9 months): RM2+
b)Potential target price for short term ( less than 3 month) : RM1.8+
c)1stSuggest Entry Price: RM1.08 to RM1.12 (which has been shown on my last post)
d)2nd suggest entry price : RM1.48 to RM1.50 level ( after it break thru RM1.47 level)
e)Suggested Cut Loss Price: you can set at 8% or break the support level. (remember ; this is importance)

Disclaimer: This blog is not to be construed as a recommendation to buy or sell any securities. All information and comments are provided for educational purposes only. I however do not hold myself responsible for its accuracy as well as your stock trading or investing decision.

Saturday, April 29, 2006

IPOWER (continue from post 24/4/06)


From Trigger Point System point of view on the Volume & Price pattern , A TPS calculation on the support level price to be RM1.08 to RM1.12 (has mentioned on last post). In very short term , the price will consolidate in between RM1.08 to RM1.20 , watch out for any volume and price change take place during 1045am to 1145am or 1450pm to 1600pm from now onward.
IPOWER will test for the resistance level on RM1.27 and RM1.47 in short term

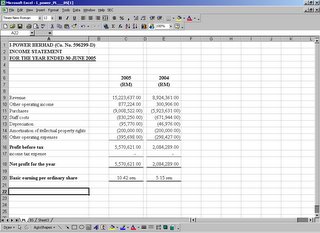
Refer above for the IPOWER financial report for the last year 2005 , Just for the reference on its good fundamental.

Tuesday, April 25, 2006

IPOWER (Intermediate term trading stock)

IPOWER has run into the side way zoom , but the uptrend still intact, base on the calculation of retracement value, its should be very strong support on RM1.08 to RM1.12 , worth to monitor by basing on the TPS system.

The cut loss point to be set at rm0.99 , pls execute the cut loss point if something wrong is happened in order to protect your capital.
(edited on 25/4/06 1230hrs , afternoon close at RM1.19)

Disclaimer: This blog is not to be construed as a recommendation to buy or sell any securities. All information and comments are provided for educational purposes only. I however do not hold myself responsible for its accuracy as well as your stock trading or investing decision

Saturday, April 22, 2006

Professional TA ( Technical Analysis) trader

My personal view on Professional TA ( Technical Analysis) trader;
1) A trading system
He/she must have a trading system to help them on the trading stock decision , The system must included of trading method, mindset & fund management.
1a)Trading Method ;
Trading method is to let them to know ;
How to find pattern in chart and discover good profit, How to recognize them before everyody else and e ready for the big moves, How to determine your best entry location and confirm the pattern are genuine,How to trade them with minimun risk and maximun profit.
A professional TA will base on the above mentioned to execute the trading decision.

2)Fund management
A Professional TA , must know how to set for their profit taking point & cut loss point , they must also know ,how to get the higher return from the market.

3)Mindset
A Professional TA must have the discipline to execute the decision base on the trading method, if hit to the cut loss point, they have to execute for the cut loss, in order to protect thier capital from the bigger loss . they also need to know how to take the profit from the market, in order to give them to have the better profit.
A Professional TA will not listen to what the rumours say, they will base on the what the market say & follow the market trend.

Thursday, April 20, 2006

IFCA ( A very short term trading counter)

Today IFCA has shown the signal to enter , this afternoon (20/4/06)close at 0.485 , the strong support at 0.40 , pls put on your safety belt if you want to enter the market.
This stock is buy high sell higher method, of course the risk and the gain is propotional to each other.
Prepare you cut loss point & if the stock goes up, pls set your profit taking point.
but bear in mind , if the stock drop below 0.4 , you have to exit this stock.

To those who interested in IFCA on 21/4/06:
-If the price at 9am to 10am is at negative , pls dont buy in.
-If the price of IFCA at 11am is higher than 9am, you can consider to buy in a. If lower than 9am, pls dont buy in.
-If you had bought during 9 am to 10am, you need to monitor 11am, if 11am is lower than 9 am, you need to be careful. if higher than 9 am, you can let the profit run & monitor again on 3.30pm
-If you bought in on 11am, you need to watch out on 3.30pm , if the price is below 11am, you need to be careful, if the price more than 11am, you can let the profit run.
-Pls refer to the time pattern to execute the action.The above time pattern only applicable on IFCA tomorrow only.
The time pattern will vary from time to time and counter to counter, pls do not use the above mentioned time pattern to execute for other counter, it may give you some fault signal.


To anybody who like to learn the TPS(trigger point system), can you send your name and contact number to teybl05@yahoo.com.sg , i will arrange some preview session of TPS to you.
TPS (Trigger point system ) is consists of chart pattern, volume pattern, price pattern and time pattern.The course also included of how to handle a case after you buying, what are thing you need to look after, you will definately know what to do and to make decision before/after you enter the market.The course will be conducted in Chinese language.

Disclaimer: This blog is not to be construed as a recommendation to buy or sell any securities. All information and comments are provided for educational purposes only. I however do not hold myself responsible for its accuracy as well as your stock trading or investing decision.

Thursday, April 13, 2006

CHINFOK(7897)

To those who willing to take risk, you can monitor on above counter, you risk is 6 cents on yesterday closing price but you profit is more than 6 cents.

Friday, April 07, 2006

CANONE

The sydnicate start to push today(18/4/06), to confirm the trend, if tomorrow 11am is the higher price than 9am, mean the sydndicate is inside the boat, but if the 11am price is on negative , you need to becareful. The Canone syndicate very cunning, but from today movement we can know that the syndicate is start to push.
The cut loss point for this counter to be set at RM1.04.
To be a Professional trader ,we have to perform on what we have set for and cut loss will be able to limit your loss become bigger & bigger , if the price continues to further drop.

18/4/2006 close at 1.23

Thursday, April 06, 2006

CANONE

CANONE has been suffering for a few months of the side way, this morning (6/4/06) it trigger the short term bell for us to ride on another higher wave, watch out for this counter. the closing price on 6/4/06 is RM1.13


Disclaimer: This blog is not to be construed as a recommendation to buy or sell any securities. All information and comments are provided for educational purposes only. I however do not hold myself responsible for its accuracy as well as your stock trading or investing decision.

Saturday, April 01, 2006

GHLSYS

Technically GHLSYS still on the uptrend (This is the most importance element) , as long as this counter donot drop below 20cents . Even though the movement of GHLsys is a bit slow now, but this is a very good sign of the youth bull has been build on here, at any moment of time now, this counter will show you the crazy movement if the ground work has been completed.
Further more , the Mesdaq now is on the bull run, GHLsys will definately benefit from here.

By the way , i have some question here, hope someone can give me the answer or try to guess;
1)How to define bull run?
2)Do you know how the bull run formated & how it formated ?
3)Why at this moment, the Mesdaq bull run than others index?
4)which counter do you think it lead the Mesdaq to bull run?

The Trigger point system has it strength to detect the signal.

I have my own set of answer, just want to get the opinion first , before i give my own set answer.

Friday, March 31, 2006

ETITECH 0118

Afternoon close price at RM0.71 , worth to Monitor.

This counter has shown good opportunity & robust technical supprt, worth to monitor & short term might have good profit.


Disclaimer: This blog is not to be construed as a recommendation to buy or sell any securities. All information and comments are provided for educational purposes only. I however do not hold myself responsible for its accuracy as well as your stock trading or investing decision.

Thursday, March 30, 2006

Profit taking and cut loss

profit taking & cut loss is importance;
profit taking is to protect you hard earn profit from the stock & cut loss is to protect your capital.
you may consider below suggestion ;
1)sell when the price hit below the support line.
2)sell when the price drop below 8% from the recent high.
3)when the price continuesly aggerssive break new high & price gap are very huge, take the profit.

By the way, Lion corp has been out of the TPS short term counter, the reason is this counter stay in very passive position.


Disclaimer: This blog is not to be construed as a recommendation to buy or sell any securities. All information and comments are provided for educational purposes only. I however do not hold myself responsible for its accuracy as well as your stock trading or investing decision.

Wednesday, March 29, 2006

Lion Corp, Nova & GHLsys

After the market close(29/3/06), Lion corp end up down 1 cents to RM0.66 , technically its in the passive position, tomorrow will be the final day to determine it again. i will update again on tomorrow.

As for the Nova, i think most of you have make very good handsome money on here, i would suggest that if you think you have make enough (almost 90%), you can consider to sell 1/2 of the stake and another 1/2 stake you have 60%:40% to fight with the market, of course you chance is 60% but doesnt mean you will win, This counter will have big fluactuation tomorrow . if the price below RM0.13 , you can consider to take another 1/2 stake of fighting profit. if the price keep going up you can let the profit run.

As for GHLsys , the trend is on the uptrend, you can let the profit run , the trend is strong.

Tuesday, March 28, 2006

Lion corp and Lion diversified

As posted on Last Saturday and Sunday (26/3/06)on www.cari .com chinese forum on Lion Corp and Lion diversified , both counter has handsome profit.
As mentioned earlier, Trigger point system , there are 2 method on how to operate the system;
1)Lion Corp is at the Buy Low sell high method, as last friday(24/3/06), the counter actually give a very good signal to enter (RM0.595), therefore i immediate put the counter inside the forum and hopefully people can get a piece of cake from the market(28/3/06 is RM0.67).
Technically Lion corp now (28/3/06) is entering a very critical Zoom which to determine the extension strogness of the price movement and tomorrow it will tell its in the position of passive or proactive (importance), i will update tomorrow after the market close(29/3/06) .
2)Lion diversified is buy high and sell higher method, Technically this counter is strong, its still has good potential to move higher. The initial signal of this counter also on 24/3/06 (RM4.18), but 2 day later now is at RM4.60

Saturday, March 25, 2006

IE, Nova & GHLsys

IE, Nova & GHLsys has enter into the side way zoom, as you can see the pricing gap is at the narrow range, the volume for GHLsys and IE & Nova are low as compare to last week but the price donot move downward, meaning that the support is strong, at any moment of time these 3 counter has its strength to re-bound back to higher . The trend for these 3 counter are on the uptrend, still worth to buy and hold . The 25/3/06 closing price for GHLsys :RM0.18 , Nova:RM0.085 and IE:RM0.125


Disclaimer: This blog is not to be construed as a recommendation to buy or sell any securities. All information and comments are provided for educational purposes only. I however do not hold myself responsible for its accuracy as well as your stock trading or investing decision.

Friday, March 24, 2006

Trigger Point System

Trigger Point system consist of
1)Buy low sell high
2)Buy high sell higher .
Typically Malaysia stock market is full of opportunity of making wealth, we can make a lot of money provided we have a good system to apply. The Trigger point system is designed for the investor who like to invest in the stock or speculate in stock market.
Buy low sell high is typically buy at the very low, for instance; A stock fell down from the high, and this stock reached to a bottom, it will give some signal for investor to buy in, but the initial signal is weak and at the meantime the syndicate has accunulated a lot of stake on hand. Once the syndicate has enough to control the number of percentage of stake, they will create a lot of buy signal to let the investor or speculator to join in. so , if we buy at the high side , our chance of winning is low.therefore the Trigger point system has introduced on how to buy at the low.
Buy high sell higher is typically buy at the high side or break out, this is a short term trading, the profit margin is high, but syndicate also like to create a false signal, therfore , the trigger point systeml will filter out the false signal.
The strength of Trigger point system as follow;
1)How to find pattern in chart and discover good profit,
2)How to recognize them before everyody else and e ready for the big moves,
3)How to determine your best entry location and confirm the pattern are genuine,
4)How to trade them with minimun risk and maximun profit